Your Instructors will grade the last git push you submit by the deadline. However, after we review the HW together during lab, you can push additional changes to improve your grade.
We’ll be looking for:
Computation — correct, runnable code
Analysis — appropriate statistical approach for the data structure
Synthesis — interpretation of results in the context of the cat experiment
Written communication — concise explanations that demonstrate understanding
Background
This challenge builds upon what you’ve learned labs and lectures so far about: creating & comparing models, parameter inference, and marginal effects. Your goal is to analyze the following dataset from an experiment that used a 2 (skill) x 3 (hand) x 2 (limit) design:
Variable
Description
skill
a player’s skill (expert/average)
hand
the quality of the hand experimenters manipulate (bad/neutral/good)
limit
the style of game (fixed/no-limit)
balance
a player’s final balance in Euros
balance is our outcome variable and we’re interested in how the other variables predict balance.
Tips:
Refer to the lecture slides from this week and last week on the course website to refresh yourself
Feel free to refer to the previous notebooks in this repo from this week and previous weeks to refresh on Python specifics
Refer to out the bossanova documentation website to more get details about specific functions (getting familiar with reading documentation is a great skill to learn things quickly!):
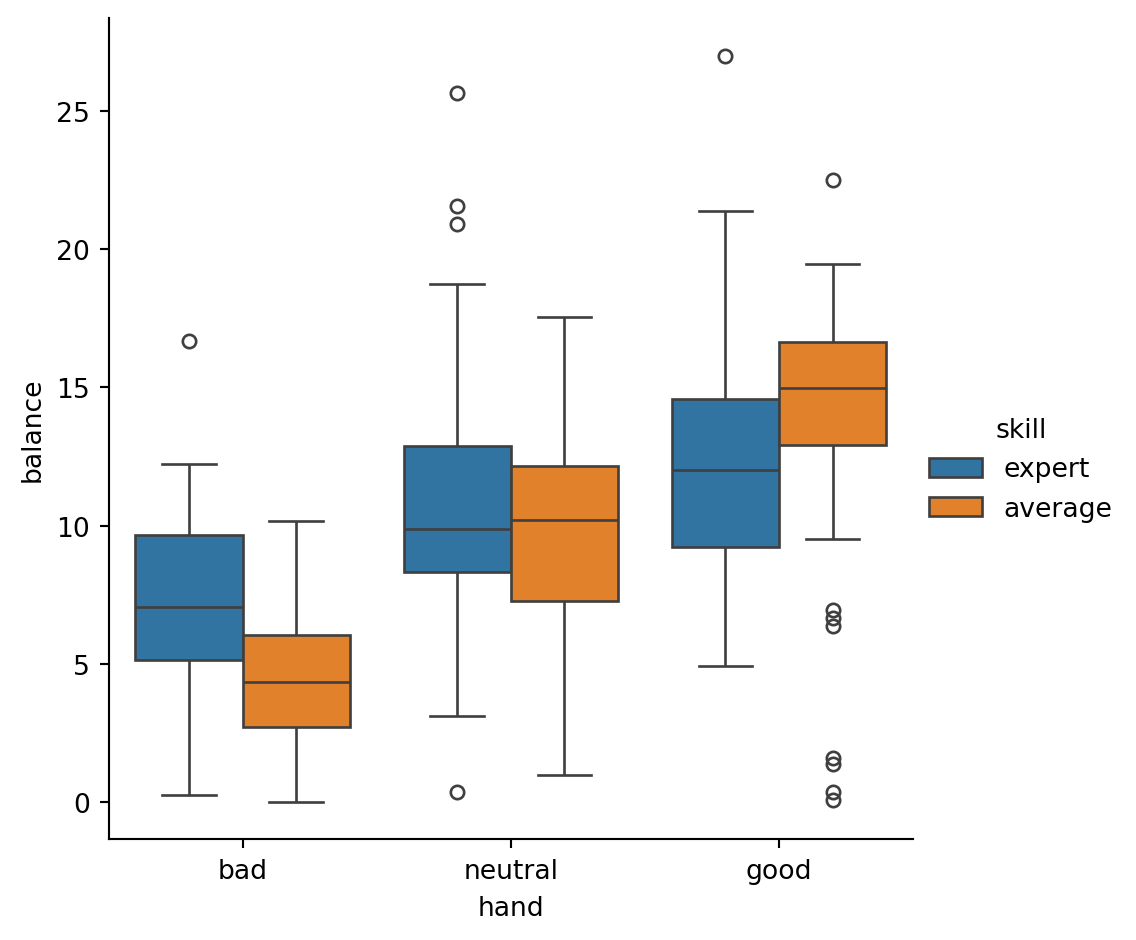
Based on your visual exploratory analysis above articulate the specific hypotheses you want to test as a series of model comparisons, i.e. compact and augmented models using compare(). You should also verify your approach against .jointest().
What factors are worth it in predicting a player’s balance?
You can use the compare(m1,m2,m3,...) from bossanova to compare more that 2 models at the same time. The output will always be sorted by model complexity – simpler at the top, most complex at the bottom
Code
from bossanova import compare

n3 = model("balance ~ hand * skill * limit ", poker).fit()
3. Effect Interpretation
Based on the model you chose, explain the relationships by exploring the model’s predictions. Can you zoom-in on specific comparisons to unpack what’s going on?
Code
n3.explore('skill ~ hand@[bad] + limit')
shape: (4, 4)
limit
hand
skill
estimate
str
str
str
f64
"fixed"
"bad"
"average"
5.05
"fixed"
"bad"
"expert"
7.329
"no-limit"
"bad"
"average"
4.123
"no-limit"
"bad"
"expert"
7.264
4. Uncertainty & Inference
You should now use .infer() on any .explore() or .fit() to talk about the uncertainty of your estimates. How much do you trust what you see?
Does changing your inference strategy change your conclusions?
5. Summary & Communication
Finally, write up a few sentences reporting your statistical findings with proper APA formatting.