Wrap-up Challenge#
We’ve provided a file called starwars.csv in this folder (you should see it in the file explorer on the left). This is a tidy dataset that you’re going to practice your Polars and Seaborn skills on by answering the following questions.
Note: if you find it helpful to see similar commands on this same data using dplyr in R, they’re available here
For clarity we’re going to re-import everything you normally might when working with real data.
import polars as pl
from polars import col, when, lit
import polars.selectors as cs

import seaborn as sns
import matplotlib.pyplot as plt # for customization if needed
Inspecting data#
Load the file and print the first few rows:
# Your code here
# Solution
sw = pl.read_csv('starwars.csv')
sw.head()
| name | height | mass | hair_color | skin_color | eye_color | birth_year | sex | gender | homeworld | species |
|---|---|---|---|---|---|---|---|---|---|---|
| str | f64 | f64 | str | str | str | f64 | str | str | str | str |
| "Luke Skywalker" | 172.0 | 77.0 | "blond" | "fair" | "blue" | 19.0 | "male" | "masculine" | "Tatooine" | "Human" |
| "C-3PO" | 167.0 | 75.0 | null | "gold" | "yellow" | 112.0 | "none" | "masculine" | "Tatooine" | "Droid" |
| "R2-D2" | 96.0 | 32.0 | null | "white, blue" | "red" | 33.0 | "none" | "masculine" | "Naboo" | "Droid" |
| "Darth Vader" | 202.0 | 136.0 | "none" | "white" | "yellow" | 41.9 | "male" | "masculine" | "Tatooine" | "Human" |
| "Leia Organa" | 150.0 | 49.0 | "brown" | "light" | "brown" | 19.0 | "female" | "feminine" | "Alderaan" | "Human" |
How many rows are in the DataFrame total?
# Your code here
# Solution
sw.shape
(87, 11)
How many missing values are in each column?
Hint: checkout .null_count()
# Your code here
# Solution
sw.null_count()
| name | height | mass | hair_color | skin_color | eye_color | birth_year | sex | gender | homeworld | species |
|---|---|---|---|---|---|---|---|---|---|---|
| u32 | u32 | u32 | u32 | u32 | u32 | u32 | u32 | u32 | u32 | u32 |
| 0 | 6 | 28 | 5 | 0 | 0 | 44 | 4 | 4 | 10 | 4 |
How many unique characters are there?
Hint: for quick operations you can directly refer to a rows/columns using slicing [] syntax
# Your code here
# Solution
sw['name'].n_unique()
87
Return a list of the unique “species” in the data and sort them alphabetically
# Your code here
# Solution
sw['species'].unique().sort()
| species |
|---|
| str |
| null |
| "Aleena" |
| "Besalisk" |
| "Cerean" |
| "Chagrian" |
| … |
| "Vulptereen" |
| "Wookiee" |
| "Xexto" |
| "Yoda's species" |
| "Zabrak" |
Return the number of observations for each unique “eye-color”
Hint: checkout .value_counts()
# Your code here
# Solution
sw['eye_color'].value_counts()
| eye_color | count |
|---|---|
| str | u32 |
| "dark" | 1 |
| "red, blue" | 1 |
| "unknown" | 3 |
| "gold" | 1 |
| "orange" | 8 |
| … | … |
| "blue" | 19 |
| "white" | 1 |
| "pink" | 1 |
| "green, yellow" | 1 |
| "brown" | 21 |
Wrangling Data#
Ok lets use the contexts and expressions we’ve learned to about filter and aggregate this data in different ways.
Filter rows to get character’s whose “gender” is “masculine” and “height” is above the median height of all characters.
How many rows in the result?
# Your code here
# Solution
sw.filter(
    col('gender').eq('masculine') & col('height').ge(col('height').median())
)
| name | height | mass | hair_color | skin_color | eye_color | birth_year | sex | gender | homeworld | species |
|---|---|---|---|---|---|---|---|---|---|---|
| str | f64 | f64 | str | str | str | f64 | str | str | str | str |
| "Darth Vader" | 202.0 | 136.0 | "none" | "white" | "yellow" | 41.9 | "male" | "masculine" | "Tatooine" | "Human" |
| "Biggs Darklighter" | 183.0 | 84.0 | "black" | "light" | "brown" | 24.0 | "male" | "masculine" | "Tatooine" | "Human" |
| "Obi-Wan Kenobi" | 182.0 | 77.0 | "auburn, white" | "fair" | "blue-gray" | 57.0 | "male" | "masculine" | "Stewjon" | "Human" |
| "Anakin Skywalker" | 188.0 | 84.0 | "blond" | "fair" | "blue" | 41.9 | "male" | "masculine" | "Tatooine" | "Human" |
| "Wilhuff Tarkin" | 180.0 | null | "auburn, grey" | "fair" | "blue" | 64.0 | "male" | "masculine" | "Eriadu" | "Human" |
| … | … | … | … | … | … | … | … | … | … | … |
| "San Hill" | 191.0 | null | "none" | "grey" | "gold" | null | "male" | "masculine" | "Muunilinst" | "Muun" |
| "Grievous" | 216.0 | 159.0 | "none" | "brown, white" | "green, yellow" | null | "male" | "masculine" | "Kalee" | "Kaleesh" |
| "Tarfful" | 234.0 | 136.0 | "brown" | "brown" | "blue" | null | "male" | "masculine" | "Kashyyyk" | "Wookiee" |
| "Raymus Antilles" | 188.0 | 79.0 | "brown" | "light" | "brown" | null | "male" | "masculine" | "Alderaan" | "Human" |
| "Tion Medon" | 206.0 | 80.0 | "none" | "grey" | "black" | null | "male" | "masculine" | "Utapau" | "Pau'an" |
Expand your filter to also exclude rows where a character’s “mass” is missing (null).
How many rows remain?
# Your code here
# Solution
sw.filter(
    col('gender').eq('masculine') & col('height').ge(col('height').median()) & col('mass').is_not_null()
)
| name | height | mass | hair_color | skin_color | eye_color | birth_year | sex | gender | homeworld | species |
|---|---|---|---|---|---|---|---|---|---|---|
| str | f64 | f64 | str | str | str | f64 | str | str | str | str |
| "Darth Vader" | 202.0 | 136.0 | "none" | "white" | "yellow" | 41.9 | "male" | "masculine" | "Tatooine" | "Human" |
| "Biggs Darklighter" | 183.0 | 84.0 | "black" | "light" | "brown" | 24.0 | "male" | "masculine" | "Tatooine" | "Human" |
| "Obi-Wan Kenobi" | 182.0 | 77.0 | "auburn, white" | "fair" | "blue-gray" | 57.0 | "male" | "masculine" | "Stewjon" | "Human" |
| "Anakin Skywalker" | 188.0 | 84.0 | "blond" | "fair" | "blue" | 41.9 | "male" | "masculine" | "Tatooine" | "Human" |
| "Chewbacca" | 228.0 | 112.0 | "brown" | "unknown" | "blue" | 200.0 | "male" | "masculine" | "Kashyyyk" | "Wookiee" |
| … | … | … | … | … | … | … | … | … | … | … |
| "Wat Tambor" | 193.0 | 48.0 | "none" | "green, grey" | "unknown" | null | "male" | "masculine" | "Skako" | "Skakoan" |
| "Grievous" | 216.0 | 159.0 | "none" | "brown, white" | "green, yellow" | null | "male" | "masculine" | "Kalee" | "Kaleesh" |
| "Tarfful" | 234.0 | 136.0 | "brown" | "brown" | "blue" | null | "male" | "masculine" | "Kashyyyk" | "Wookiee" |
| "Raymus Antilles" | 188.0 | 79.0 | "brown" | "light" | "brown" | null | "male" | "masculine" | "Alderaan" | "Human" |
| "Tion Medon" | 206.0 | 80.0 | "none" | "grey" | "black" | null | "male" | "masculine" | "Utapau" | "Pau'an" |
Expand your filter to include the previous result or characters whose “skin_color” is ‘dark’ or ‘pale’
How many rows in this result?
# Your code here
# Solution
sw.filter(
    (col('gender').eq('masculine') &
     col('height').ge(col('height').median()) &
     col('mass').is_not_null()) |
     col('skin_color').is_in(['dark', 'pale'])
)
| name | height | mass | hair_color | skin_color | eye_color | birth_year | sex | gender | homeworld | species |
|---|---|---|---|---|---|---|---|---|---|---|
| str | f64 | f64 | str | str | str | f64 | str | str | str | str |
| "Darth Vader" | 202.0 | 136.0 | "none" | "white" | "yellow" | 41.9 | "male" | "masculine" | "Tatooine" | "Human" |
| "Biggs Darklighter" | 183.0 | 84.0 | "black" | "light" | "brown" | 24.0 | "male" | "masculine" | "Tatooine" | "Human" |
| "Obi-Wan Kenobi" | 182.0 | 77.0 | "auburn, white" | "fair" | "blue-gray" | 57.0 | "male" | "masculine" | "Stewjon" | "Human" |
| "Anakin Skywalker" | 188.0 | 84.0 | "blond" | "fair" | "blue" | 41.9 | "male" | "masculine" | "Tatooine" | "Human" |
| "Chewbacca" | 228.0 | 112.0 | "brown" | "unknown" | "blue" | 200.0 | "male" | "masculine" | "Kashyyyk" | "Wookiee" |
| … | … | … | … | … | … | … | … | … | … | … |
| "Tarfful" | 234.0 | 136.0 | "brown" | "brown" | "blue" | null | "male" | "masculine" | "Kashyyyk" | "Wookiee" |
| "Raymus Antilles" | 188.0 | 79.0 | "brown" | "light" | "brown" | null | "male" | "masculine" | "Alderaan" | "Human" |
| "Sly Moore" | 178.0 | 48.0 | "none" | "pale" | "white" | null | null | null | "Umbara" | null |
| "Tion Medon" | 206.0 | 80.0 | "none" | "grey" | "black" | null | "male" | "masculine" | "Utapau" | "Pau'an" |
| "Finn" | null | null | "black" | "dark" | "dark" | null | "male" | "masculine" | null | "Human" |
What is the average height and average mass of characters who are from a “homeworld” whose name starts with the letters ‘Co’?
Hint: you can “chain” a .select() onto the result of a .filter()
# Your code
sw.filter(
    col('homeworld').str.starts_with('Co')
).select(
    col('height','mass').mean()
)
| height | mass |
|---|---|
| f64 | f64 |
| 175.666667 | 71.5 |
Summarize the mean and standard-deviation of the “height” and “mass” of all non-Human characters, split by “sex”, and sort the result by the mean height in descending order.
Hint: you can chain a .group_by() after a .filter(), and chain .sort() at the end
# Your code here
# Solution
sw.filter(
    ~col('species').eq('Human')
).group_by('sex').agg(
    height_mean = col('height').mean(),
    height_std = col('height').std(),
    mass_mean = col('mass').mean(),
    mass_std = col('mass').std(),
).sort('height_mean', descending=True)
| sex | height_mean | height_std | mass_mean | mass_std |
|---|---|---|---|---|
| str | f64 | f64 | f64 | f64 |
| "female" | 179.571429 | 16.081637 | 53.866667 | 3.089768 |
| "male" | 176.911765 | 46.299007 | 76.48 | 34.240717 |
| "hermaphroditic" | 175.0 | null | 1358.0 | null |
| "none" | 131.2 | 49.149771 | 69.75 | 51.031853 |
Extend your summary to filter out any values of “sex” that are “hermaphroditic” or “none” (not missing/null!)
# Your code here
# Solution
sw.filter(
    ~col('species').eq('Human') & ~col('sex').is_in(['hermaphroditic', 'none'])
).group_by('sex').agg(
    height_mean = col('height').mean(),
    height_std = col('height').std(),
    mass_mean = col('mass').mean(),
    mass_std = col('mass').std(),
).sort('height_mean', descending=True)
| sex | height_mean | height_std | mass_mean | mass_std |
|---|---|---|---|---|
| str | f64 | f64 | f64 | f64 |
| "female" | 179.571429 | 16.081637 | 53.866667 | 3.089768 |
| "male" | 176.911765 | 46.299007 | 76.48 | 34.240717 |
Add a column to the original DataFrame called “mass_lbs” that converts “mass” to lbs by multiplying by 2.2 and drop all remaining columns except: name, height, and species.
Remove any rows with null values and save the result to a new DataFrame called sw_processed
# Your code here
# Solution
sw_processed = (
    sw.with_columns(
        mass_lbs = col('mass') * 2.2
    ).select(['name','height','species','mass_lbs']).drop_nulls()
)
sw_processed
| name | height | species | mass_lbs |
|---|---|---|---|
| str | f64 | str | f64 |
| "Luke Skywalker" | 172.0 | "Human" | 169.4 |
| "C-3PO" | 167.0 | "Droid" | 165.0 |
| "R2-D2" | 96.0 | "Droid" | 70.4 |
| "Darth Vader" | 202.0 | "Human" | 299.2 |
| "Leia Organa" | 150.0 | "Human" | 107.8 |
| … | … | … | … |
| "Shaak Ti" | 178.0 | "Togruta" | 125.4 |
| "Grievous" | 216.0 | "Kaleesh" | 349.8 |
| "Tarfful" | 234.0 | "Wookiee" | 299.2 |
| "Raymus Antilles" | 188.0 | "Human" | 173.8 |
| "Tion Medon" | 206.0 | "Pau'an" | 176.0 |
Use the new DataFrame you created sw_processed to add 2 additional columns called “height_z_species” and “mass_lbs_z_species” that are z-scored versions of height and mass_lbs by “species”
Save the DataFrame by overwriting the previous variable sw_processed
# Your code here
# Solution
zscore = lambda name: ( col(name) - col(name).mean() ) / col(name).std()

sw_processed = sw_processed.with_columns(
    height_z_species = zscore('height').over('species'),
    mass_lbs_z_species = zscore('mass_lbs').over('species'),
)

sw_processed
| name | height | species | mass_lbs | height_z_species | mass_lbs_z_species |
|---|---|---|---|---|---|
| str | f64 | str | f64 | f64 | f64 |
| "Luke Skywalker" | 172.0 | "Human" | 169.4 | -0.71983 | -0.222945 |
| "C-3PO" | 167.0 | "Droid" | 165.0 | 0.519167 | 0.102877 |
| "R2-D2" | 96.0 | "Droid" | 70.4 | -0.84605 | -0.739734 |
| "Darth Vader" | 202.0 | "Human" | 299.2 | 1.897735 | 2.828964 |
| "Leia Organa" | 150.0 | "Human" | 107.8 | -2.639378 | -1.671308 |
| … | … | … | … | … | … |
| "Shaak Ti" | 178.0 | "Togruta" | 125.4 | null | null |
| "Grievous" | 216.0 | "Kaleesh" | 349.8 | null | null |
| "Tarfful" | 234.0 | "Wookiee" | 299.2 | 0.707107 | 0.707107 |
| "Raymus Antilles" | 188.0 | "Human" | 173.8 | 0.676204 | -0.11949 |
| "Tion Medon" | 206.0 | "Pau'an" | 176.0 | null | null |
Whats the shape of the result?
# Your code here
# Solution
sw_processed.shape
(56, 6)
How many unique characters are in the result?
# Your code here
sw_processed['name'].n_unique()
56
Drop all non-zscored numeric columns and once again save the result to sw_processed, overwriting your previous DataFrame
# Your code here
# Solution
sw_processed = sw_processed.drop(['height', 'mass_lbs'])
sw_processed
| name | species | height_z_species | mass_lbs_z_species |
|---|---|---|---|
| str | str | f64 | f64 |
| "Luke Skywalker" | "Human" | -0.71983 | -0.222945 |
| "C-3PO" | "Droid" | 0.519167 | 0.102877 |
| "R2-D2" | "Droid" | -0.84605 | -0.739734 |
| "Darth Vader" | "Human" | 1.897735 | 2.828964 |
| "Leia Organa" | "Human" | -2.639378 | -1.671308 |
| … | … | … | … |
| "Shaak Ti" | "Togruta" | null | null |
| "Grievous" | "Kaleesh" | null | null |
| "Tarfful" | "Wookiee" | 0.707107 | 0.707107 |
| "Raymus Antilles" | "Human" | 0.676204 | -0.11949 |
| "Tion Medon" | "Pau'an" | null | null |
What is Leia Organa’s height in z-scores?
# Your code here
# Solution
sw_processed.filter(
    col('name').eq('Leia Organa')
).select('name', 'height_z_species')
| name | height_z_species |
|---|---|
| str | f64 |
| "Leia Organa" | -2.639378 |
Who’s heavier in z-scores, Owen Lars or Darth Vader and by how much approximately?
# Your code here
# Solution
sw_processed.filter(
    col('name').is_in(['Owen Lars', 'Darth Vader'])
).select('name', 'mass_lbs_z_species')
| name | mass_lbs_z_species |
|---|---|
| str | f64 |
| "Darth Vader" | 2.828964 |
| "Owen Lars" | 2.001328 |
Add in a column to your DataFrame sw_processed called “height_category” that splits characters based upon the z-scored height.
If their height is between (or including) -2 and 2 their height_category should be in the “normal”.
If their height is < -2 their height_category should be in the “short”.
If their height is > 2 their height_category should be in the “tall”.
Take the resulting column along with the “name” and “species” columns and save them to a new DataFrame variable called sw_heights
# Your code here
# Solution
sw_heights = sw_processed.with_columns(
    height_category = when(col('height_z_species').ge(-2).and_(col('height_z_species').le(2)))
                      .then(lit('normal'))
                      .when(col('height_z_species').lt(-2))
                      .then(lit('short'))
                      .otherwise(lit('tall'))

).select('name','species', 'height_category')
sw_heights
| name | species | height_category |
|---|---|---|
| str | str | str |
| "Luke Skywalker" | "Human" | "normal" |
| "C-3PO" | "Droid" | "normal" |
| "R2-D2" | "Droid" | "normal" |
| "Darth Vader" | "Human" | "normal" |
| "Leia Organa" | "Human" | "short" |
| … | … | … |
| "Shaak Ti" | "Togruta" | "tall" |
| "Grievous" | "Kaleesh" | "tall" |
| "Tarfful" | "Wookiee" | "normal" |
| "Raymus Antilles" | "Human" | "normal" |
| "Tion Medon" | "Pau'an" | "tall" |
Summarize the number of unique species by “height_category”. How many of each are there?
# Your code here
# Solution
sw_heights.group_by('height_category').agg(
    col('species').n_unique()
)
| height_category | species |
|---|---|
| str | u32 |
| "short" | 1 |
| "tall" | 26 |
| "normal" | 5 |
Are there any humans in the “tall” category?
Hint: try using .unique() inside of a .group_by() context. Then use a .select() context on the result that includes an expression using the .list attribute operations to check if ‘Human’ is one of the list items
# Your code here
# Solution
sw_heights.group_by('height_category').agg(
    col('species').unique()
).select(
    col('height_category'),
    col('species').list.contains('Human')
)
| height_category | species |
|---|---|
| str | bool |
| "normal" | true |
| "short" | true |
| "tall" | false |
Visualizing Data#
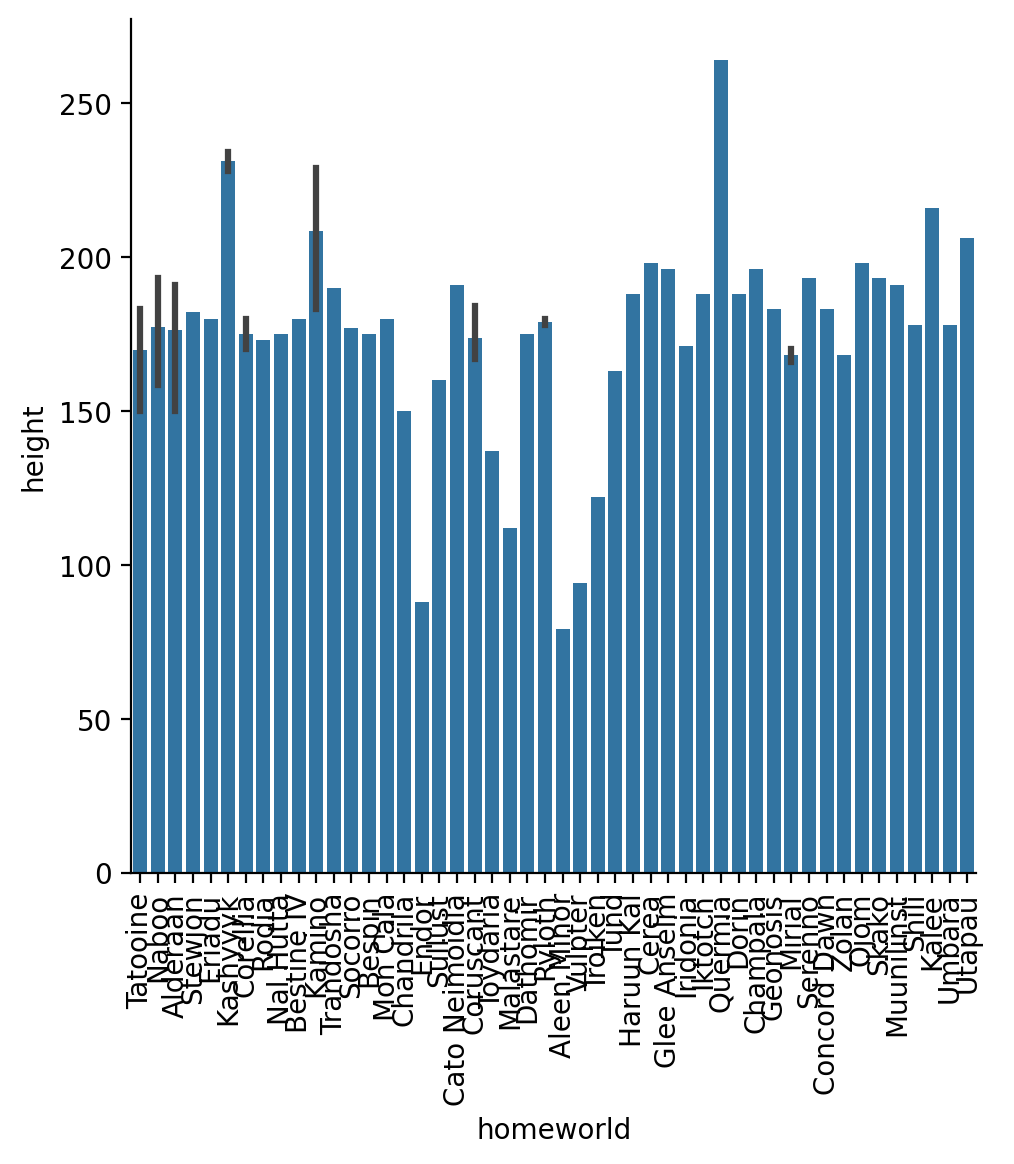
Using the original (unfiltered/aggregated) DataFrame, create a bar-plot showing the mean height for each homeworld and rotate the x-labels by 90 degrees
Hint: You can use sns.barplot to get back a matplotlib axis that you can customize
Or sns.catplot with kind='bar' to get back a Seaborn FacetGrid that is customized slightly differently
# Your code here
g = sns.catplot(data=sw, x='homeworld', y='height', kind='bar')
g.set_xticklabels(rotation=90)
<seaborn.axisgrid.FacetGrid at 0x317e26f50>
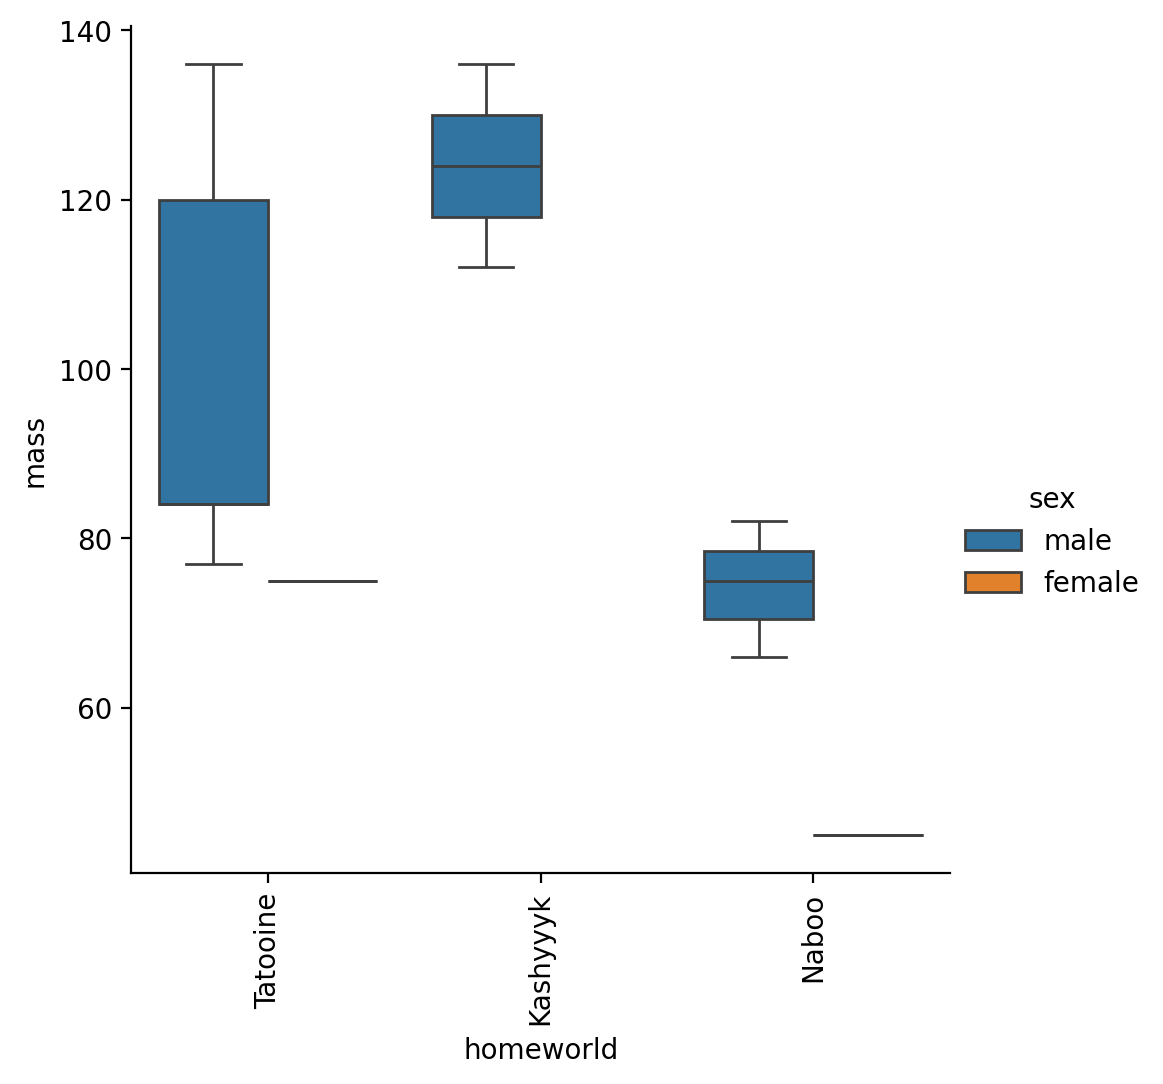
Make a box plot of “mass” for only male and female characters who’s homeworld is Tatooine, Naboo, or Kashyyyk
Hint: you’ll have to filter the data first
# Your code here
to_plot = sw.filter(
    col('sex').is_in(['male', 'female']),
    col('homeworld').is_in(['Tatooine', 'Naboo', 'Kashyyyk'])
)
g = sns.catplot(data=to_plot, x='homeworld', y='mass', kind='box', hue='sex')
g.set_xticklabels(rotation=90)
<seaborn.axisgrid.FacetGrid at 0x3183a2190>
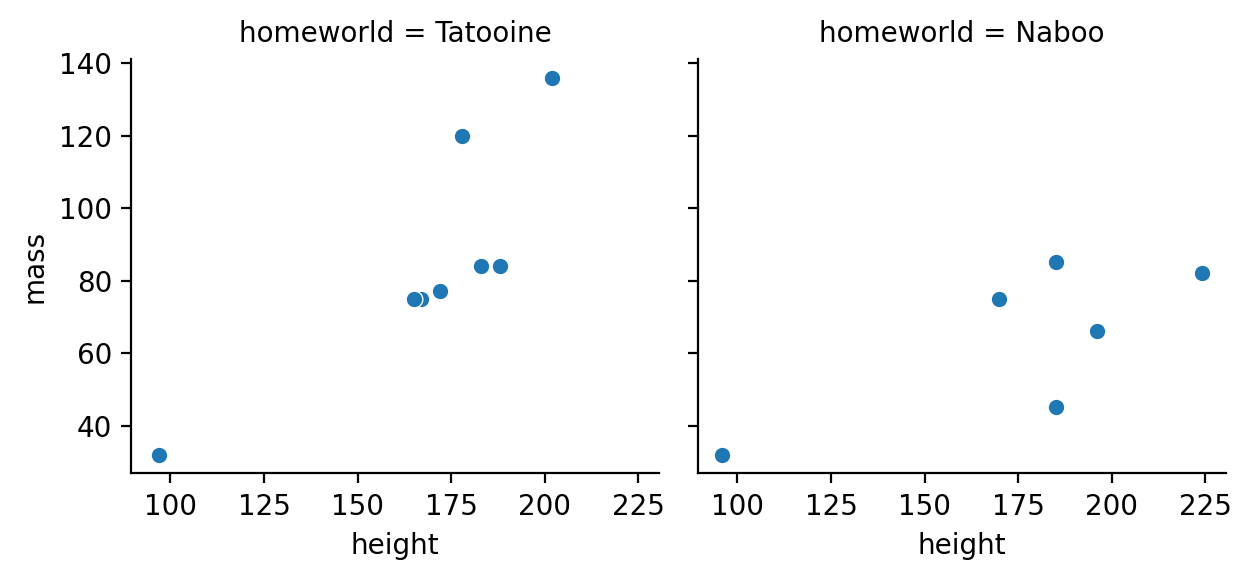
Create a facet-grid of 2 scatter plots between height and mass separately for Tatooine and Naboo
Hint: you’ll have to filter again first
Then check-out the multi-plot grid tutorial for help
# Your code here
to_plot = sw.filter(
    col('homeworld').is_in(['Tatooine', 'Naboo'])
)
g = sns.FacetGrid(to_plot, col='homeworld', col_wrap=4)
g.map(sns.scatterplot, 'height', 'mass')
<seaborn.axisgrid.FacetGrid at 0x318a2b490>
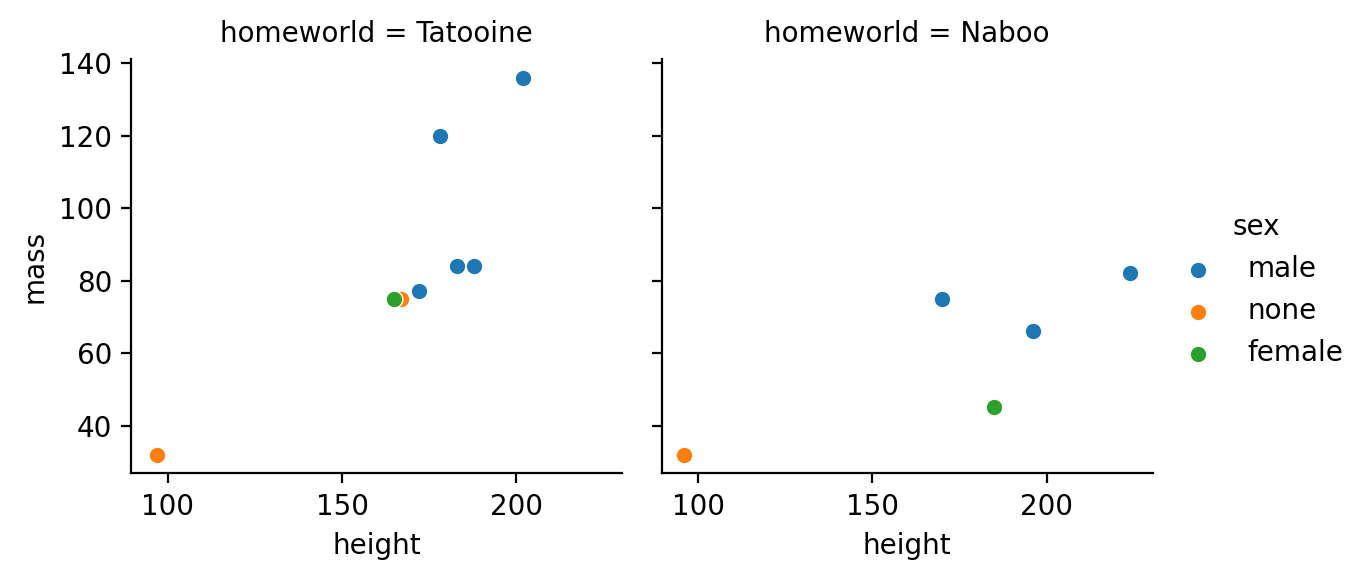
Update the plot to color points by sex
Hint: you can use the .add_legend() method on a FaceGrid to display the legend
# Your code here
to_plot = sw.filter(
    col('homeworld').is_in(['Tatooine', 'Naboo'])
)
g = sns.FacetGrid(to_plot, col='homeworld', hue='sex')
g.map(sns.scatterplot, 'height', 'mass')
g.add_legend()
<seaborn.axisgrid.FacetGrid at 0x319c27f10>
<seaborn.axisgrid.FacetGrid at 0x319c27f10>
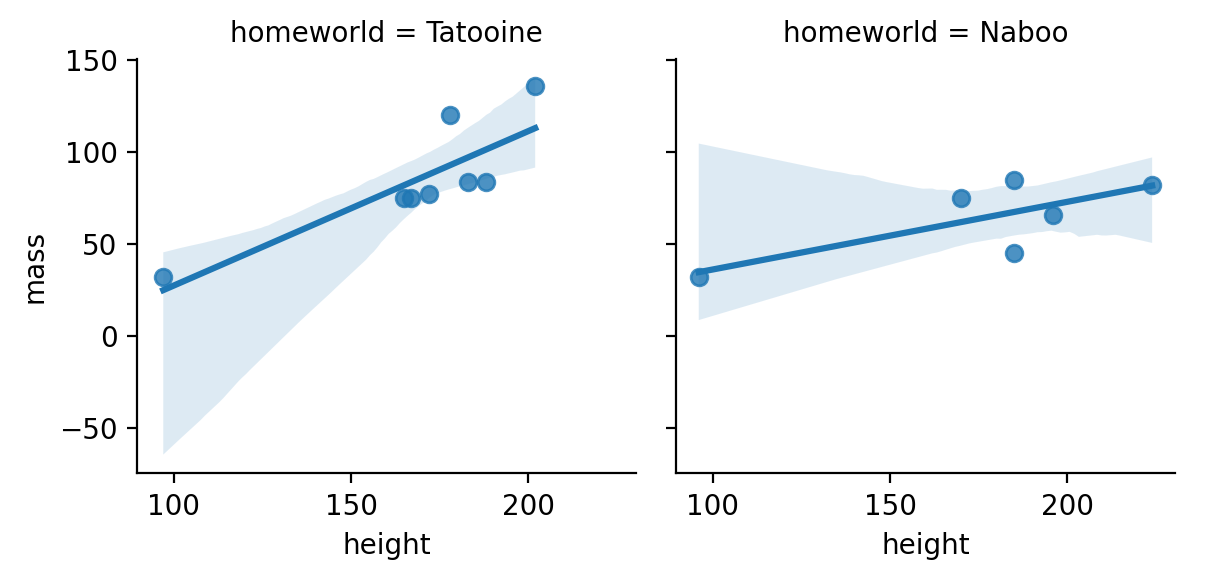
Remove the color by gender and add a regression line to each plot.
For which homeworld is there a stronger relationship?
Hint: you can use the .add_legend() method on a FaceGrid to display the legend
# Your code here
to_plot = sw.filter(
    col('homeworld').is_in(['Tatooine', 'Naboo'])
)
g = sns.FacetGrid(to_plot, col='homeworld')
g.map(sns.regplot, 'height', 'mass')
g.add_legend()
<seaborn.axisgrid.FacetGrid at 0x317b255d0>
<seaborn.axisgrid.FacetGrid at 0x317b255d0>
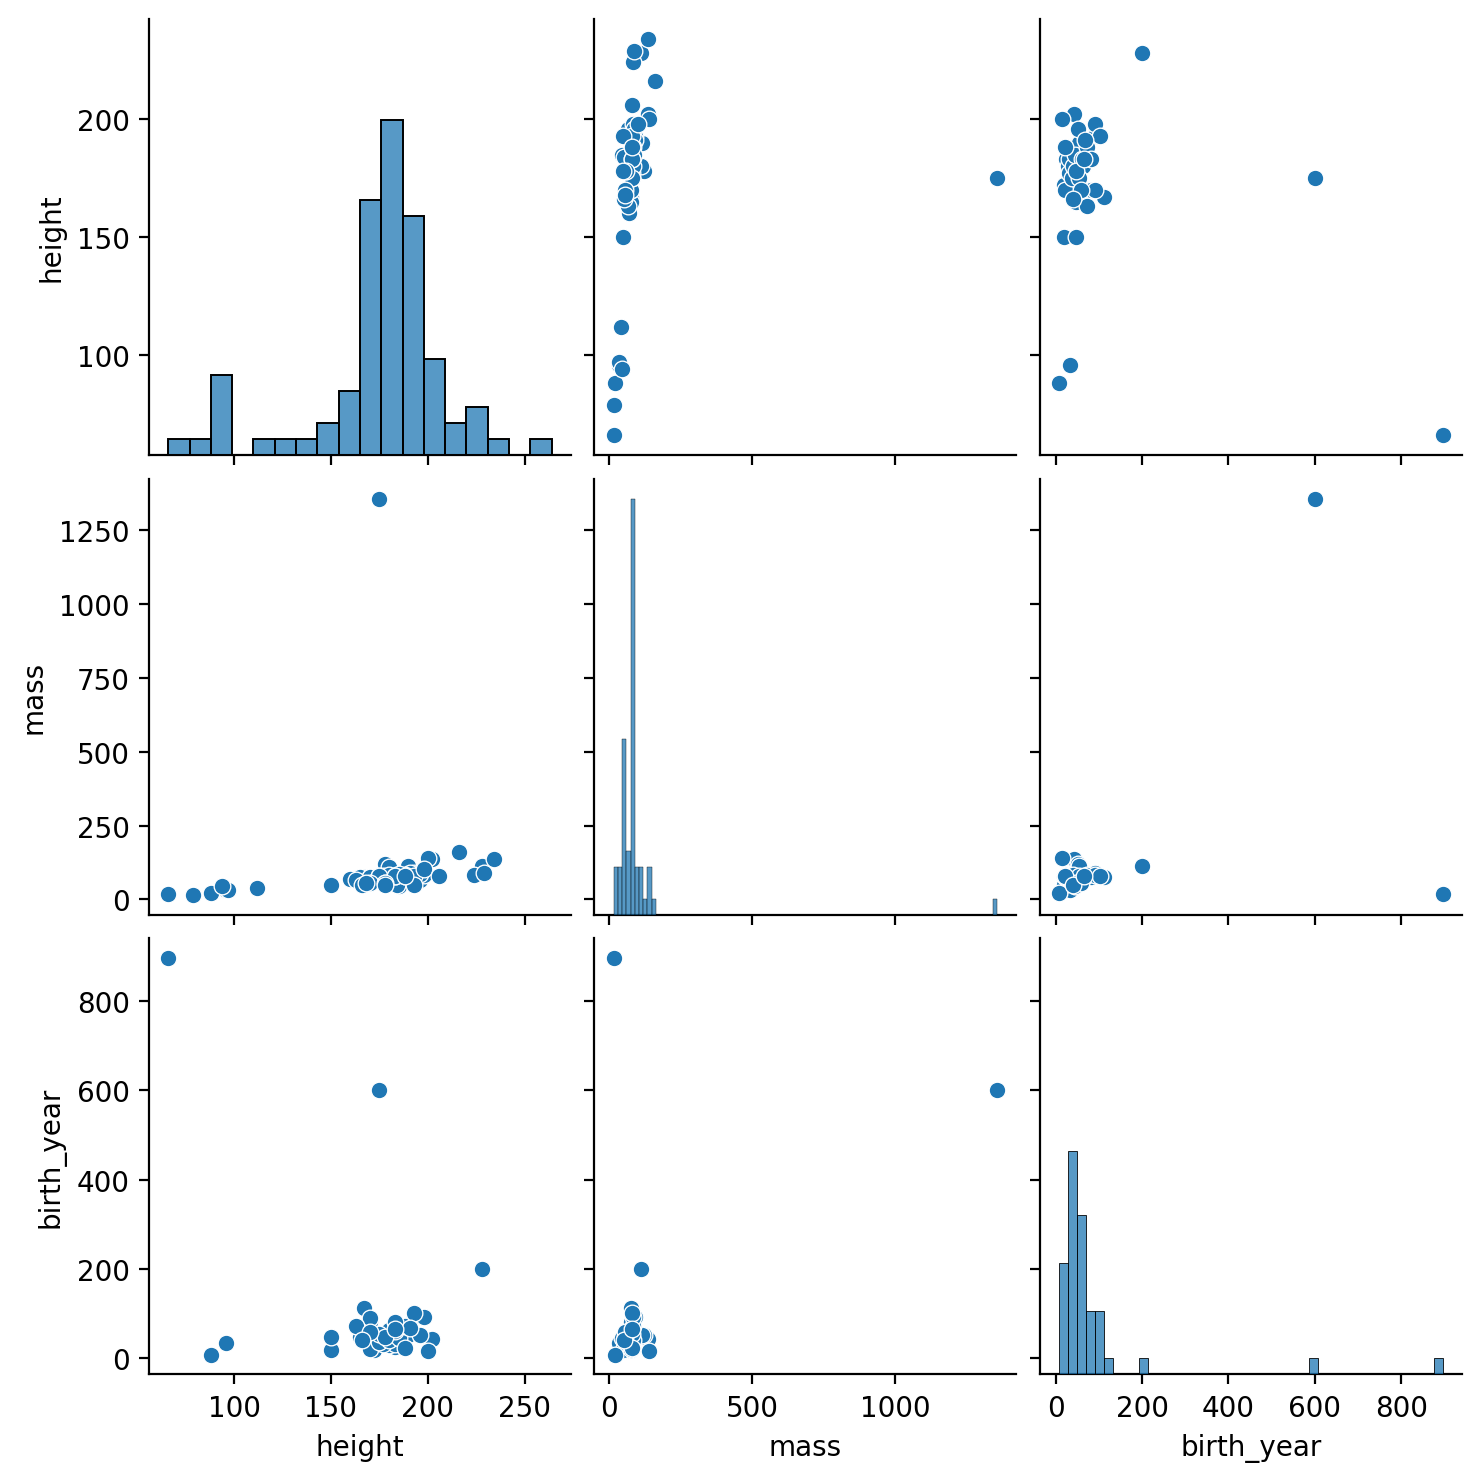
Take a look at the pairwise relationships between all numeric columns
Hint: you’ll have to select the columns you want first
Then take a look at sns.pairplot()
If you run into an error, remember you can eaasily convert between a Polars and Pandas DataFrame
# Your code here
to_plot = sw.select(
    cs.numeric()
).to_pandas()

sns.pairplot(to_plot)
<seaborn.axisgrid.PairGrid at 0x319cfe090>